Risk warning
I advice everybody to trade with a DEMO account!
Tuesday, February 8, 2011
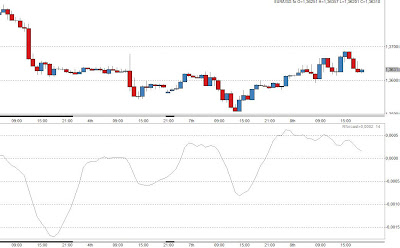
Regressive Forcast Indicator
This indicator plots the difference between the Time Series Forcast indicator and the Lineair Regression indicator.
indicator RegressiveForcast;
/*written by ctlprogrammer*/
/*you can freely copy the code but plz leave this header*/
/*http://ctltrading.blogspot.com*/
input period = 14;
draw line1("Rforcast");
begin
integer f := front(close);
integer b := back(close);
series tsf,linr;
Time_Series_Forecast();
tsf:=Time_Series_Forecast.line;
Linear_Regression();
linr:=Linear_Regression.line;
for f:=1 to b do
begin
line1[f]:=tsf[f]-linr[f];
end;
end.
An explanation of the code line by line:
indicator RegressiveForcast;
=> here you freely choose the name you want the indicator to have, in this example RegressiveForcast
/*written by ctlprogrammer*/
/*you can freely copy the code but plz leave this header*/
/*http://ctltrading.blogspot.com*/
=> between /* and */ you can put commentary, has no impact on the indicator
input period = 14;
=> here you add the parameters that you want to be adjustable, in this case we want to be able to change the period of the Time Series Forcast indicator and the Lineair Regression indicator
draw line1("Rforcast");
=> here you specifie the lines that the indicator will draw, you can freely choose the name between " ", in this example we choose Rforcast
begin
=> actual start of the indicator with its calculations
integer f := front(close); => the number of the first candle on the chart, candle most left on the chart
integer b := back(close); => the number of the last candle on the chart, candle most right on the chart
series tsf,linr; => here you define the series that you are going to use
Time_Series_Forecast(); => here the indicator is initialised
tsf:=Time_Series_Forecast.line; => here is specified that we are going to use the line of the indicator
Linear_Regression(); => here the indicator is initialised
linr:=Linear_Regression.line; => here is specified that the line is going to be used
for f:=1 to b do => from the first candle to the last candle
begin => do the following
line1[f]:=tsf[f]-linr[f]; => the series the indicator is creating, the series is built up from line1[1....
up to line1[b]
end;
=> end because the serie is completely created
end.
The indicator can be used in multiple ways depending of the period you use.
In a ranging market :
go short when the RegressiveForcast is above level x and is heading down
go long when the RegressiveForcast is below level -x and is heading up
In a trending market:
go long when the RegressiveForcast crosses the zero line upwards
go short when the RegressiveForcast crosses the zeo line downwards
partial profit taking can be done when the RegressiveForcast changes it direction
Subscribe to:
Post Comments (Atom)

Rebonjour,
ReplyDeleteI can not load this indicator the RegressiveForcast as chart studio said:
line 8 col 9: error unexpected IDENTIFIER
Pass line 9 9: error unexpected IDENTIFIER
line 10 col 1: unexpected error SERIES
With many thanks again
Bests regards
vicbergeron@orange.fr
indicator RegressiveForcast;
Delete/*written by ctlprogrammer*/
/*you can freely copy the code but plz leave this header*/
/*http://ctltrading.blogspot.com*/
input period = 14;
draw line1("Rforcast");
vars f(number),b(number),tsf(series),linr(series);
begin
f := front(close);
b := back(close);
Time_Series_Forecast();
tsf:=Time_Series_Forecast.line;
Linear_Regression();
linr:=Linear_Regression.line;
for f:=1 to b do
begin
line1[f]:=tsf[f]-linr[f];
end;
end.